
EXCITING NEWS
IMPORTANT SHAREHOLDER INFORMATION
PIA’s Board has announced its intention to transition the Company’s portfolio to the ANTIPODES GLOBAL SMID investment strategy.
This is the same investment strategy that is used by the Antipodes Global SMID ETF.
The Antipodes Global SMID strategy has returned 26.7% p.a. since inception (2 November 2022) to 31 July 2026, outperforming its benchmark by 13.7% p.a. , while over the most recent 12 months it returned 24.3%, exceeding the benchmark return of 10.2% by 14.1 percentage points.
FIND OUT MORE ABOUT THE NEW STRATEGY HERENote that the above website link is for the Antipodes Global SMID ETF. The intended investment strategy will be the same as that used by this ETF but will not be an ETF, ie PIA will remain a listed investment company that targets the payment of fully franked dividends to shareholders.
Performance of the Antipodes Global SMID Active ETF (ASX: MIDS) to 31 July 2026. Past performance is not a reliable indicator of future performance. The PIA portfolio may differ from the MIDS portfolio due to PIA’s ethical screening requirements and other portfolio construction considerations.
SHARE PRICE
NTA PRE-TAX
NTA POST-TAX
Portfolio return
(20 years)
DIVIDEND YIELD1
consecutive quarterly dividends paid
1. Dividend yield is based on current displayed share price, and the most recently declared dividend, annualised
2. Grossed up yield is based on current displayed share price, the most recently declared dividend, annualised, and the tax rate and franking percentage applicable for the most recently declared dividend
INTERNATIONAL. ETHICAL. DIVIDENDS.
THE LARGEST INTERNATIONAL ETHICALLY SCREENED LIC ON THE ASX
Targeting fully-franked dividends. Paid quarterly.
Pengana International Equities Limited (trading on the ASX as ‘PIA’) is an Australian Listed Investment Company (“LIC”) that exists to provide shareholders with capital growth over the long term from investing in an ethically screened and actively managed portfolio of global businesses in addition to providing shareholders with regular, reliable and fully franked dividends.
Benefits of investing in PIA
- Skilled investment team with a responsible investment process
- A truly active strategy with a focus on risk and return
- Investment in high quality businesses
Benefits of investing in PIA’s LIC structure
- Quarterly fully franked dividends
- Shares can be bought and sold on the ASX
- Investment activities are not affected by redemptions or unexpected cash inflows or outflows
- Regular reporting to shareholders e.g. semi-annual financial reports, monthly performance reports and weekly NTA
- Shareholders can interact with directors and management
- The company is subject to ASX and ASIC supervision
The portfolio utilises a negative screening process which seeks to avoid investment in companies that derive operating revenues from direct and material business involvement* in the following sectors that the investment manager considers unethical:

*Material business involvement is generally considered to be over 5% of production of, or 15% aggregate revenue from, the production, distribution and retail of the screened product/service. For thresholds on each specific screen please refer to the Responsible Investment Policy HERE
OUR INVESTMENT PHILOSOPHY
Investing in high-quality, ethically screened, growing businesses at reasonable prices leads to superior risk-adjusted returns over the long term.
The philosophy is expressed in the four key criteria that a company must meet before we will consider it for investment:

Competitive Advantage
Sustainable return on capital above cost of capital within a supportive industry structure enabling it to earn better financial returns than rivals.

Sustainable Growth
An industry structure supporting long-term growth in revenues, earnings, and cash-flow.
Growth underpinned by long-term fundamental trends, not ephemeral factors.

Financial Strength
Balance sheet strength and free cash flow generation to fund long-term growth in all environments.

Quality Management
Skilful management with a good record, a clear strategy, and a consistent regard for shareholders.
PERFORMANCE
- CHART
- TABLE
Performance for periods greater than 12 months is the compound annual return.
Total Shareholder Return refers to the movement in share price plus dividends declared for the period, not including the benefit of franking credits attached to dividends paid
Total Portfolio Return refers to the movement in net assets per share, reversing out the impact of option exercises and payments of dividends, before tax paid or accrued on realised and unrealised gains.
Index refers to MSCI World Total Return Index, Net Dividends Reinvested, in A$.
Past performance is not a reliable indicator of future performance, the value of investments can go up and down. None of Pengana International Equities Limited (‘PIA’), Pengana Investment Management Limited nor any of their related entities guarantees the repayment of capital or any particular rate of return from PIA. This information has been prepared by PIA and does not take into account a reader’s investment objectives, particular needs or financial situation. It is general information only and should not be considered investment advice and should not be relied on as an investment recommendation. The figures are unaudited.
Source: PCG and Factset.
PERFORMANCE AT 30 Sep 2026
| 1M | 1Y | 5Y | 15Y | 20Y | |
|---|---|---|---|---|---|
| Total Portfolio Return | 1.9% | 3.8% | 4.2% | 10.2% | 6.9% |
| Total Shareholder Return | 7.5% | 9.1% | 1.7% | 8.1% | 4.4% |
| Index | 1.8% | 9.8% | 12.7% | 14.9% | 8.9% |
Swipe horizontally to see all columns
Performance for periods greater than 12 months is the compound annual return.
Total Shareholder Return refers to the movement in share price plus dividends declared for the period, not including the benefit of franking credits attached to dividends paid
Total Portfolio Return refers to the movement in net assets per share, reversing out the impact of option exercises and payments of dividends, before tax paid or accrued on realised and unrealised gains.
Index refers to MSCI World Total Return Index, Net Dividends Reinvested, in A$.
Past performance is not a reliable indicator of future performance, the value of investments can go up and down. None of Pengana International Equities Limited (‘PIA’), Pengana Investment Management Limited nor any of their related entities guarantees the repayment of capital or any particular rate of return from PIA. This information has been prepared by PIA and does not take into account a reader’s investment objectives, particular needs or financial situation. It is general information only and should not be considered investment advice and should not be relied on as an investment recommendation. The figures are unaudited.
Source: PCG and Factset.
PORTFOLIO
Total portfolio holdings as at 30 Sep 2026: 54
- TOP HOLDINGS (alphabetically)
- Portfolio breakdown









Allocations may not sum to 100% due to rounding.
THE TEAM




Key Facts
ASX CODE:
PIA
RECOMMENDED TIMEFRAME:
5 years or more
TYPICAL NUMBER OF STOCKS:
35-75
INCEPTION DATE:
PIA ASX Listing Date: 19 March 2004
Appointment of PCG as Investment Manager: 1 July 2017
Appointment of Harding Loevner as Investment Team: 10 May 2021
DIVIDEND FREQUENCY:
QUARTERLY
BENCHMARK:
MSCI World Total Return Index (net) in $A
MANAGEMENT FEE:*
1.23% p.a.
PERFORMANCE FEE:*
15.38% of any return greater than the Benchmark
*Fees are stated inclusive of GST and net of RITC.
PLATFORM AVAILABILITY
- CFS Edge
- Dash
- Hub24
- Macquarie Wrap – Super
- Mason Stevens – IDPS
- Netwealth
- Praemium
- Powerwrap
RATINGS
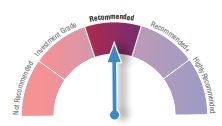
Independent Investment Research
Pengana Capital Group
Harding Loevner
Pengana International Equities Limited has been certified by RIAA according to the strict operational and disclosure practices required under the Responsible Investment Certification Program. See www.responsiblereturns.com.au for details.
RIAA’s RI Certification Symbol signifies that a product or service offers an investment style that takes into account environmental, social, governance, or ethical considerations. The Symbol also signifies that Pengana International Equities Limited adheres to the strict operational and disclosure practices required under the Responsible Investment Certification Program for the category of Product. The Certification Symbol is a Registered Trademark of the Responsible Investment Association Australasia (RIAA). Detailed information about RIAA, the Symbol and Pengana International Equities Limited’s methodology, performance, and stock holdings can be found at www.responsiblereturns.com.au, together with details about other responsible investment products certified by RIAA.1
1. The Responsible Investment Certification Program does not constitute financial product advice. Neither the Certification Symbol nor RIAA recommends to any person that any financial product is a suitable investment or that returns are guaranteed. Appropriate professional advice should be sought prior to making an investment decision. RIAA does not hold an Australian Financial Services Licence.
REPORTS AND RESOURCES
- Monthly Reports
- Responsible Investment
- Portfolio Holdings
- Documents
- September 2026 - September Report
- August 2026 - August Report
- July 2026 - July Report
- June 2026 - June Report
- May 2026 - May Report
- April 2026 - April Report
- March 2026 - March Report
- February 2026 - February Report
- January 2026 - January Report
- December 2025 - December Report
- November 2025 - November Report
- October 2025 - October Report
- View All Reports Show Fewer Reports
Portfolio holdings as at 30/06/2026
- AbbVie, Inc.
- Accenture Plc Class A
- Adobe Inc.
- AIA Group Limited
- Alimentation Couche-Tard Inc.
- Alphabet Inc. Class A
- Amazon.com, Inc.
- AMETEK, Inc.
- Amphenol Corporation Class A
- Apple Inc.
- ASML Holding NV
- AstraZeneca PLC
- Atkore Inc
- Booking Holdings Inc.
- Broadcom Inc.
- Chugai Pharmaceutical Co., Ltd.
- Compass Group PLC
- Contemporary Amperex Technology Co., Limited Class
- Danaher Corporation
- Deere & Company
- Diploma PLC
- Elevance Health, Inc.
- Epiroc AB Class A
- Equifax Inc.
- Haleon PLC
- HDFC Bank Limited Sponsored ADR
- HEICO Corporation
- Infineon Technologies AG
- Johnson & Johnson
- JPMorgan Chase & Co.
- Keyence Corporation
- Kubota Corporation
- Meta Platforms Inc Class A
- Microsoft Corporation
- Netflix, Inc.
- nVent Electric plc
- NVIDIA Corporation
- Progressive Corporation
- Reinsurance Group of America, Incorporated
- Roche Holding Ltd
- Ryanair Holdings PLC Sponsored ADR
- Samsung Electronics Co., Ltd.
- SAP SE Sponsored ADR
- Schneider Electric SE
- SGS SA
- Sony Financial Group Inc.
- Sony Group Corporation
- Spotify Technology SA
- Taiwan Semiconductor Manufacturing Co., Ltd. Spons
- Tencent Holdings Ltd
- Thermo Fisher Scientific Inc.
- Tradeweb Markets, Inc. Class A
- Visa Inc. Class A
Shareholders
EXCITING NEWS
IMPORTANT SHAREHOLDER INFORMATION
PIA’s Board has announced its intention to transition the Company’s portfolio to the ANTIPODES GLOBAL SMID investment strategy.
This is the same investment strategy that is used by the Antipodes Global SMID ETF.
The Antipodes Global SMID strategy has returned 26.7% p.a. since inception (2 November 2022) to 31 July 2026, outperforming its benchmark by 13.7% p.a. , while over the most recent 12 months it returned 24.3%, exceeding the benchmark return of 10.2% by 14.1 percentage points.
FIND OUT MORE ABOUT THE NEW STRATEGY HERENote that the above website link is for the Antipodes Global SMID ETF. The intended investment strategy will be the same as that used by this ETF but will not be an ETF, ie PIA will remain a listed investment company that targets the payment of fully franked dividends to shareholders.
Performance of the Antipodes Global SMID Active ETF (ASX: MIDS) to 31 July 2026. Past performance is not a reliable indicator of future performance. The PIA portfolio may differ from the MIDS portfolio due to PIA’s ethical screening requirements and other portfolio construction considerations.
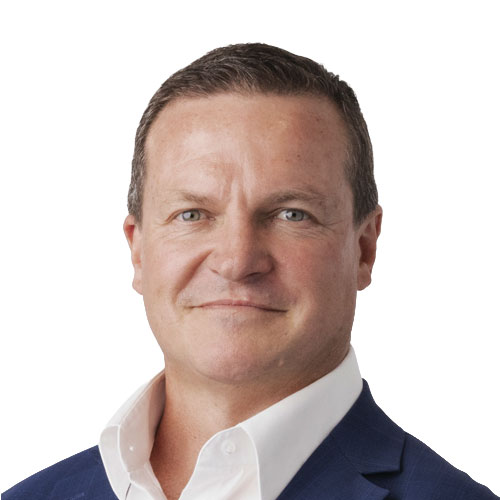
Brett Jollie
Non-Executive Chairman
Brett Jollie is a seasoned executive with over 30 years’ experience in the investment industry across Australia, Europe, and Asia. He held a range of senior roles at Aberdeen Asset Management over 23 years, including 14 years as CEO of Aberdeen’s Australian business.
More recently, Brett served as CEO of Hearts & Minds Investments Limited (ASX: HM1), an ASX-listed investment company focused on delivering high-conviction investment ideas while supporting medical research.
Brett has more than a decade of board experience, including as Independent Director and Chair of FundBase Group, Director of the Financial Services Council (FSC), Chair of the FSC Funds Management Board Committee, Executive Director of Aberdeen Asset Management, and Council Member of the Australian British Chamber of Commerce.
He holds a Bachelor of Economics, Graduate Diplomas in Applied Finance & Investment and Financial Planning, is a Fellow of the Financial Services Institute of Australia (FINSIA), and a Graduate Member of the Australian Institute of Company Directors (AICD).

Geoff Wilson
Non-Executive Director
Geoff Wilson has more than 46 years’ direct experience in investment markets having held a variety of senior investment roles in Australia, the UK and the US. Geoff founded Wilson Asset Management in 1997, which today, comprises of 20 investment professionals who offer a combined investment experience of more than 250 years. Wilson Asset Management manages $6 billion on behalf of more than 130,000 investors as the investment manager for nine listed investment companies (LICs) and two unlisted funds: Wilson Asset Management Leaders Fund and Wilson Asset Management Founders Fund. Geoff is currently Chairman of WAM Capital Limited, WAM Leaders Limited, WAM Global Limited, WAM Microcap Limited, WAM Research Limited, WAM Active Limited, WAM Strategic Value Limited and WAM Income Maximiser Limited. He is the founder and Director of Future Generation Australia Limited and Future Generation Global Limited, and Director of WAM Alternative Assets Limited. In 2014 Geoff created Australia’s first listed philanthropic wealth creation vehicles, Future Generation Australia, and subsequently Future Generation Global in 2015. In 2024 Geoff launched Future Generation Women as the first all-female managed fund in Australia, delivering investment returns and advancing economic equality and opportunities for women and their children in Australia. To date, the Future Generation companies have donated $100 million to Australian not-for-profits. Geoff holds a Bachelor of Science, a Graduate Management Qualification and is a Fellow of the Financial Services Institute of Australia and the Australian Institute of Company Directors (AICD). In addition to Geoff’s Directorships with the Wilson Asset Management Group and the Future Generation companies, he also holds Directorships with Staude Capital Global Value Fund Limited (since 2014), Hearts and Minds Investments Limited (since 2018), Sporting Chance Cancer Foundation (since 1997) and the Australian Rugby Foundation (2024).
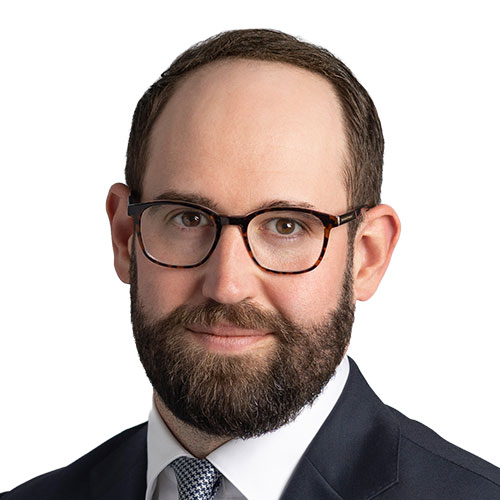
Jesse Hamilton
Non-Executive Director
Jesse Hamilton is a Chartered Accountant with more than 18 years’ experience working in advisory and assurance services, specialising in funds management. As the Chief Financial Officer, Jesse oversees all finance and accounting of Wilson Asset Management (International) Pty Limited. He is Company Secretary for WAM Alternative Assets Limited and WAM Strategic Value Limited and Joint Company Secretary for WAM Capital Limited, WAM Leaders Limited, WAM Global Limited, WAM Microcap Limited, WAM Research Limited and WAM Active Limited, in addition to Future Generation Investment Company Limited and Future Generation Global Investment Company Limited. Prior to joining Wilson Asset Management, Jesse worked as Chief Financial Officer of an ASX listed company and also worked as an advisor specialising in assurance services, valuations, mergers and acquisitions, financial due diligence and capital raising activities for listed investment companies.
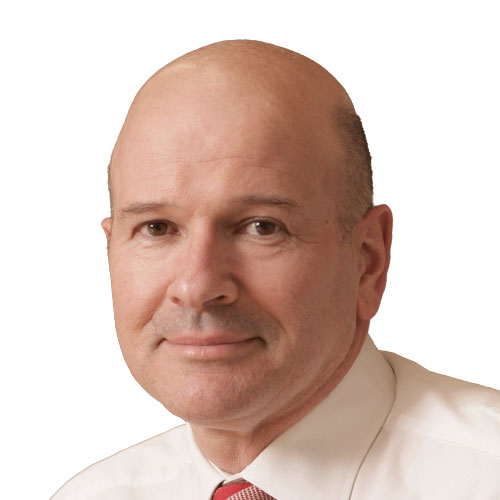
Julian Martin
Non-Executive Director
Julian Martin is an experienced Non-Executive Director and Communications Agency CEO.
His executive career spans three continents and leadership roles in global groups, leading creative agencies and as founder of three agencies. He was founding CEO of Mojo New York, the first Australian agency group in the US. He co-founded Chiat/Day/Mojo London and later was an Executive Director at BBH London, one of the premier global creative agencies.
Back in Australia Julian ran The Campaign Palace Melbourne. He also founded Love Sydney as CEO with Siimon Reynolds and successfully sold it to Photon Group (now Enero). For the last decade Julian has run his own agency, BrandCentral Sydney. He has been a leading player in creating and evolving long running campaigns for American Express, Tourism Australia, Tourism Tasmania, Qantas, Lynx, The Australian Financial Review, The Australian Football League, Colonial First State, Challenger Financial Services and Channel Seven.
Julian was Chair of SecondBite, Australia’s largest food rescue organisation from 2020-2023 and on its board from 2018 to 2024. He has a Bachelor of Economics (Finance Major), is a graduate of the Harvard Business School’s Owner President Program, and a member of the Australian Institute of Company Directors (MAICD)
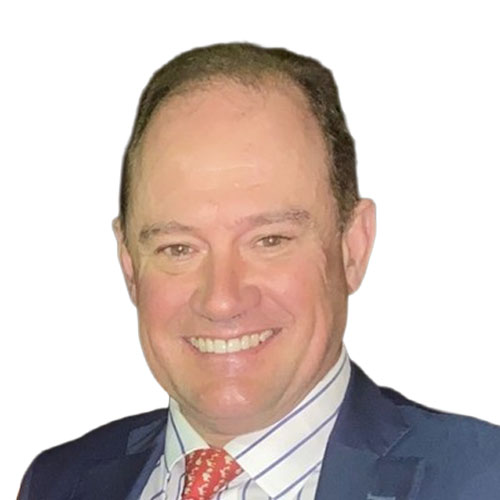
Richard Caldwell
Non-Executive Director
Richard achieved a combined law degree (BEc/LLB – Accounting Major) at Sydney University in 1984 after having completed his secondary education at The King’s School where he received the highest ATAR in his academic year.
After university, Richard was the sole graduate corporate finance intake at Citibank, Sydney.
Citibank deployed him in risk management and foreign exchange trading roles. Later, Richard moved to JP Morgan, London and thrived in the challenge of international markets. At JP Morgan he was promoted to vice-president and supervised significant debt security trading, arbitrage and portfolio management operations across a very broad spectrum of credits, from sovereign to ‘junk’. Risk management was an important focus. In 1992, Richard returned to Citibank, Sydney in the role of Head of Fixed Interest Trading.
In 1997, Richard resigned and transitioned to his original vocational calling and entered Australian stockbroking, ultimately as Head of Corporate Finance and Equity Capital Markets at Tricom where he grew the business from fledging to 4th on the Australian equity issuance league tables. Here his advisory experience included financial institutions, media, renewable energy, resources, technology and transport et al.
Richard is considered widely experienced and knowledgeable across corporations law, capital markets and governance. In that context, he was invited to conceive and teach the Equity Capital Markets stream at Macquarie University. As an industry-based lecturer, Richard taught in the university’s leading master’s degree program throughout Australia and South-East Asia from 2004 to 2010.
Since 2012, Richard has undertaken executive and non-executive roles in Australian ASX listed companies, including Greatcell Solar Limited and Southern Hemisphere Mining, where he now provides advice in treasury, fund-raising, international transactions and corporate governance.
Richard also enjoys not-for-profit roles. He was chair of the Medical Foundation, Sydney University (6 years) and chair of Ascham School Foundation (8 years). Both foundations grew very significantly in FUM and projects during the periods of his stewardship.
NEWS AND INSIGHTS
What Netflix Gains From a Warner Bros. Deal
Iconic brands, streaming subscribers, and the chance to keep them out of anyone else’s hands. One of the more striking...
Quality-Growth Investing: Digging in the Right Sandbox
For us to consider investing in a company, the underlying business must first meet four key criteria. As quality-growth investors,...